ShipShape can record a release draft and remember it. The next step is insight: once you've logged weeks of prep work — screenshots redone, metadata reviewed, keywords tweaked — you'll want to see it, edit it, and spot the patterns. A flat list that prints "Screenshots, Screenshots, Metadata, Screenshots…" over and over is noise.
In this chapter you'll turn ShipShape's ship log into something readable and revealing. You'll deduplicate repeated steps with a Set, present the log in an editable List with collapsible days and count badges, let the user add past entries through a calendar DatePicker, and finally chart the whole dataset with Swift Charts — bars, lines, and stacked series, in a few lines each.
Here's the dataset we're working with — a ShipLogStore of days, each holding the steps logged that day (a step can repeat):
struct ShipLogDay: Identifiable {
  let id = UUID()
  let date: Date
  var steps: [String] = []
}

@Observable
final class ShipLogStore {
  var days: [ShipLogDay] = []   // newest first
  static let allSteps = ["Screenshots", "Metadata", "Keywords", "Final QA"]
}
Sets: Keeping It Unique
If you loop over a day's raw steps with ForEach, you'll hit a real bug. ForEach needs to tell its elements apart, and identical strings collide:
ForEach<Array, String, Text>: the ID Screenshots occurs multiple times
within the collection, this will give undefined results!
The fix is to show each step once, with a count — and Set is built for exactly the "once" part.
Set isA Set is an unordered collection of unique values. Adding a value that's already present does nothing — duplicates simply can't exist in a set. Creating one from an array is the idiomatic way to dedupe:
Set(["Screenshots", "Metadata", "Screenshots", "Keywords", "Keywords"])
// → {"Metadata", "Keywords", "Screenshots"}   (in no particular order)
Set and Array each have an initializer that takes the other, so you can hop between "unique, unordered" and "ordered, indexable" whenever you need to.
Add a computed property to ShipLogDay that returns the distinct steps, sorted for stable display:
var uniqueSteps: [String] {
  Array(Set(steps)).sorted(by: <)
}
Set(steps) throws away the duplicates; Array(_:) turns the set back into something you can loop over; sorted(by:) gives a predictable order (a set has none of its own). Now add a method that counts how many times one step appears:
func count(of step: String) -> Int {
  steps.filter { $0 == step }.count
}
filter { $0 == step } keeps only the matching entries; .count tallies them. (You met filter and trailing closures back in Chapter 5 — same tools, new job.)
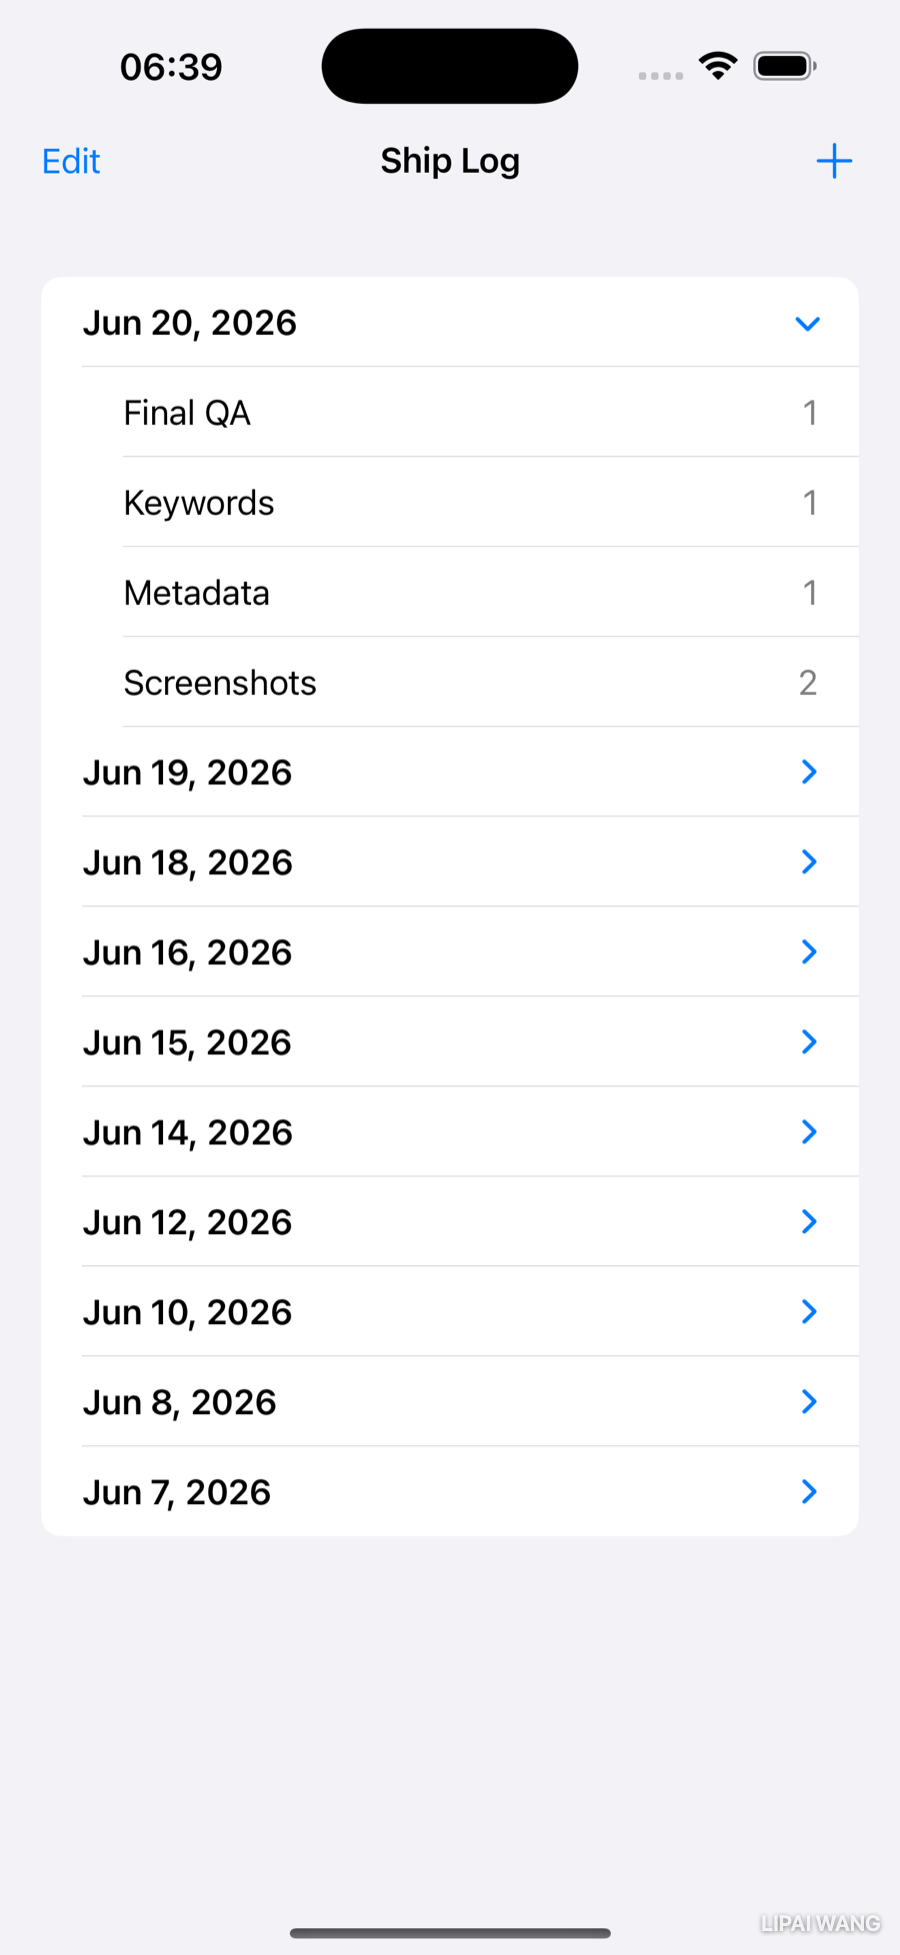
Badges: a Count at the Edge
A badge shows supplementary info at a list row's trailing edge — perfect for the count. Loop over the unique steps and badge each one:
ForEach(day.uniqueSteps, id: \.self) { step in
  Text(step)
    .badge(day.count(of: step))
}
Each step now appears once, with the number of times it was logged that day off to the right — no more duplicate-ID warning, and far less noise.
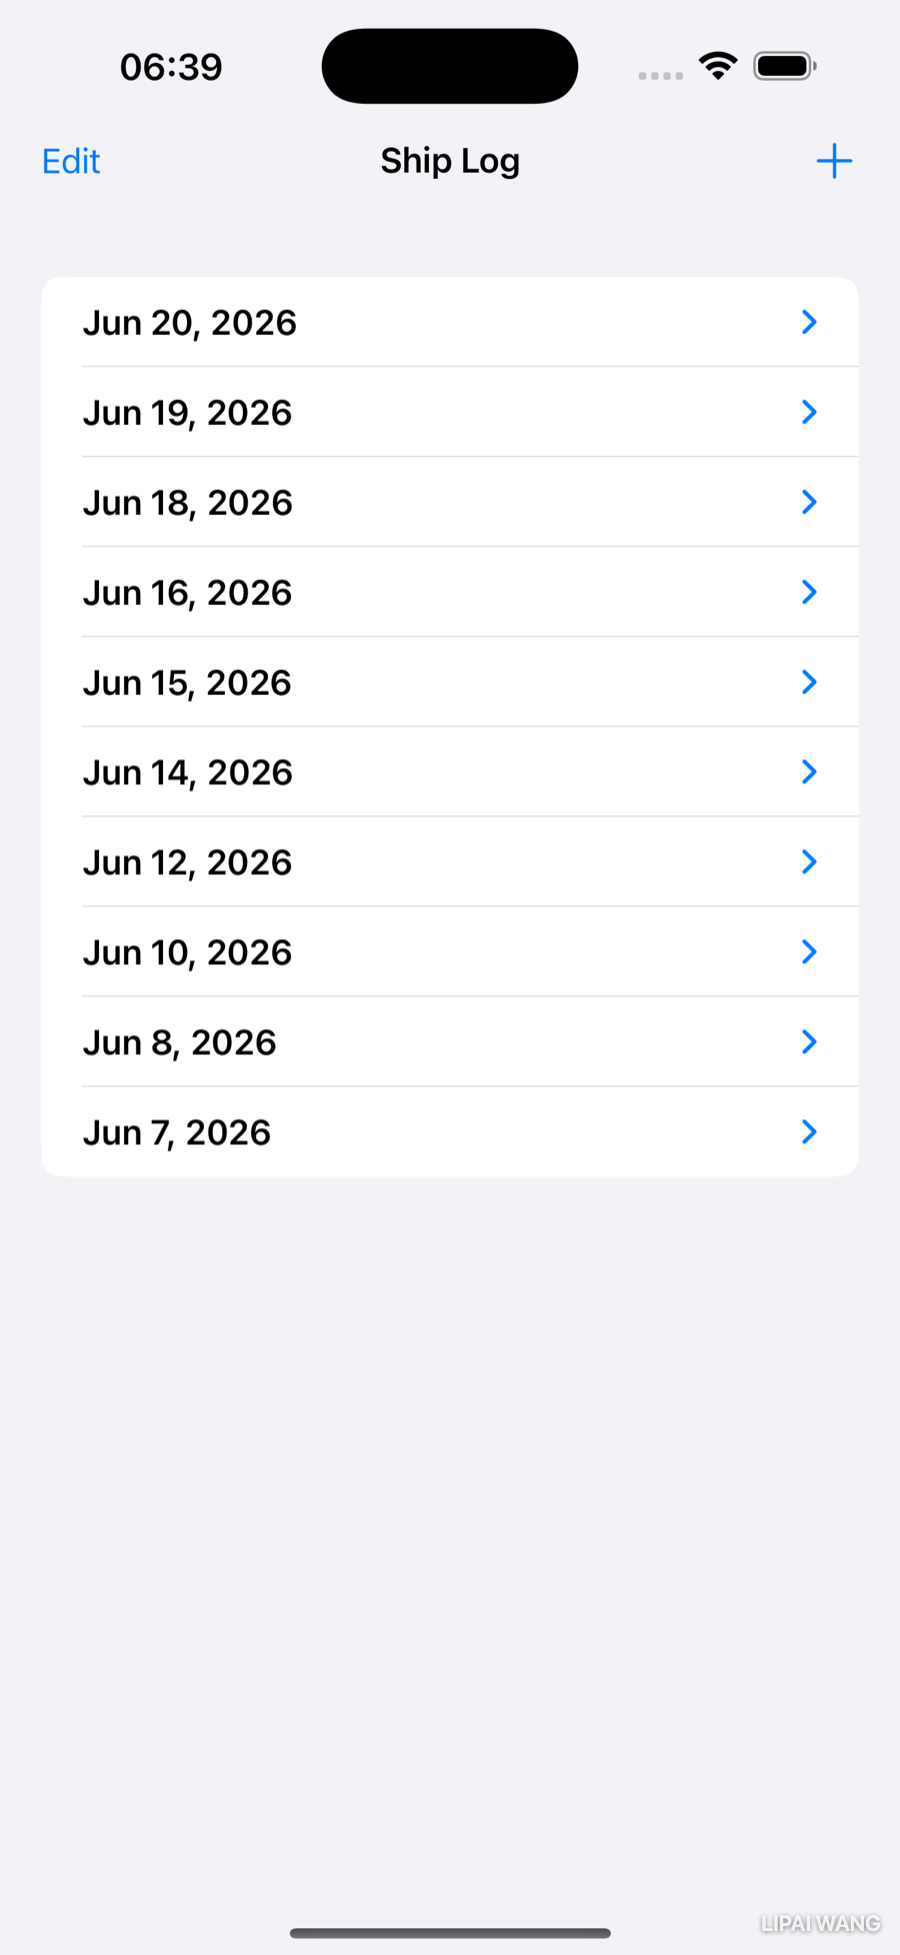
From Form to List
A Form styles input controls; a List presents rows of data, and it has editing built in. Swap to a List driven by a binding to the store's days:
List($store.days, editActions: [.delete]) { $day in
  Text(day.date.formatted(date: .abbreviated, time: .omitted))
    .font(.headline)
}
Two things are happening in that first line:
$store.daysis a binding to the array. Passing the binding (not the plain value) is what lets the list mutate the data — including deleting from it.editActions: [.delete]turns on swipe-to-delete for free. That's the whole implementation. (There's also.movefor drag-to-reorder; it doesn't make sense for date-sorted history, so we leave it off.) Inside the closure,$dayis the per-row binding anddayits value.
Swipe any row left and the Delete button appears; release past the threshold and the row is gone:
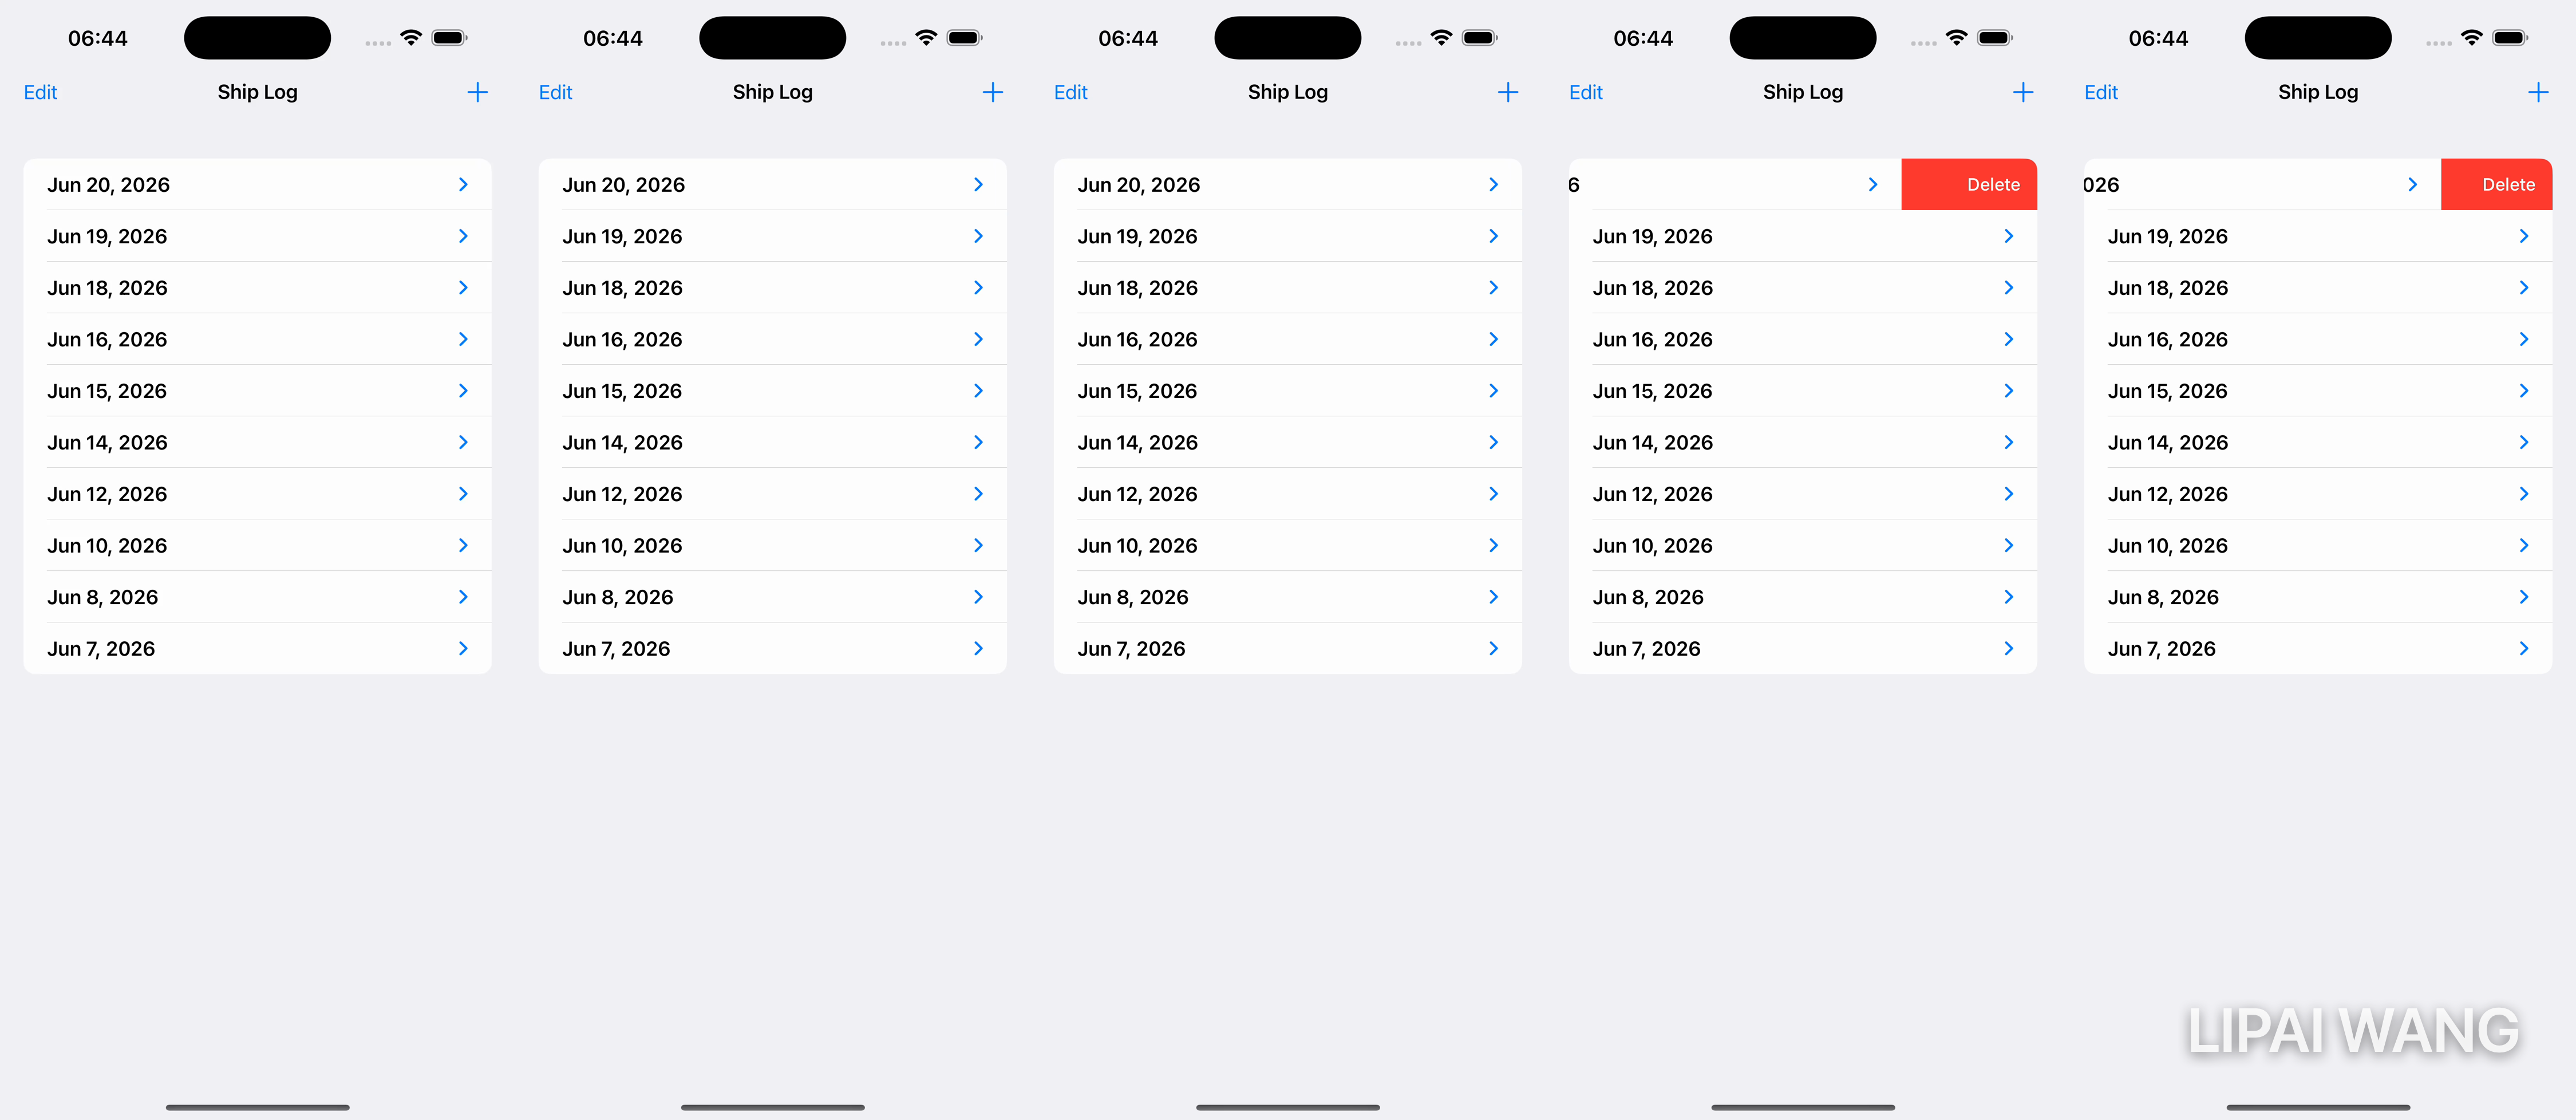
Saving the edits
A delete updates the in-memory array immediately, but it won't survive a relaunch until you write it to disk. Save when the screen goes away:
.onDisappear {
  try? store.save()   // the Codable plist save from Chapter 5, wired to the log
}
onDisappear isn't a guaranteeonDisappear fires when the user leaves the screen inside the app — but if they swipe up to the App Switcher and the system terminates the app, it may never run. For data you can't afford to lose, also save when the app changes scene phase (@Environment(\.scenePhase)), which fires on backgrounding. We'll lean on that in a later chapter; onDisappear is enough for now.
Collapsing Days With DisclosureGroup
Right now each day shows only its date. The steps live one level down — a natural hierarchy: a day is the parent, its steps the children. A DisclosureGroup shows a collapsed header you tap to expand:
List($store.days, editActions: [.delete]) { $day in
  DisclosureGroup {
    ForEach(day.uniqueSteps, id: \.self) { step in
      Text(step)
        .badge(day.count(of: step))
    }
  } label: {
    Text(day.date.formatted(date: .abbreviated, time: .omitted))
      .font(.headline)
  }
}
The label is the always-visible header; the first closure is the content revealed on expand. Tap a date and its deduped, badged steps slide open:
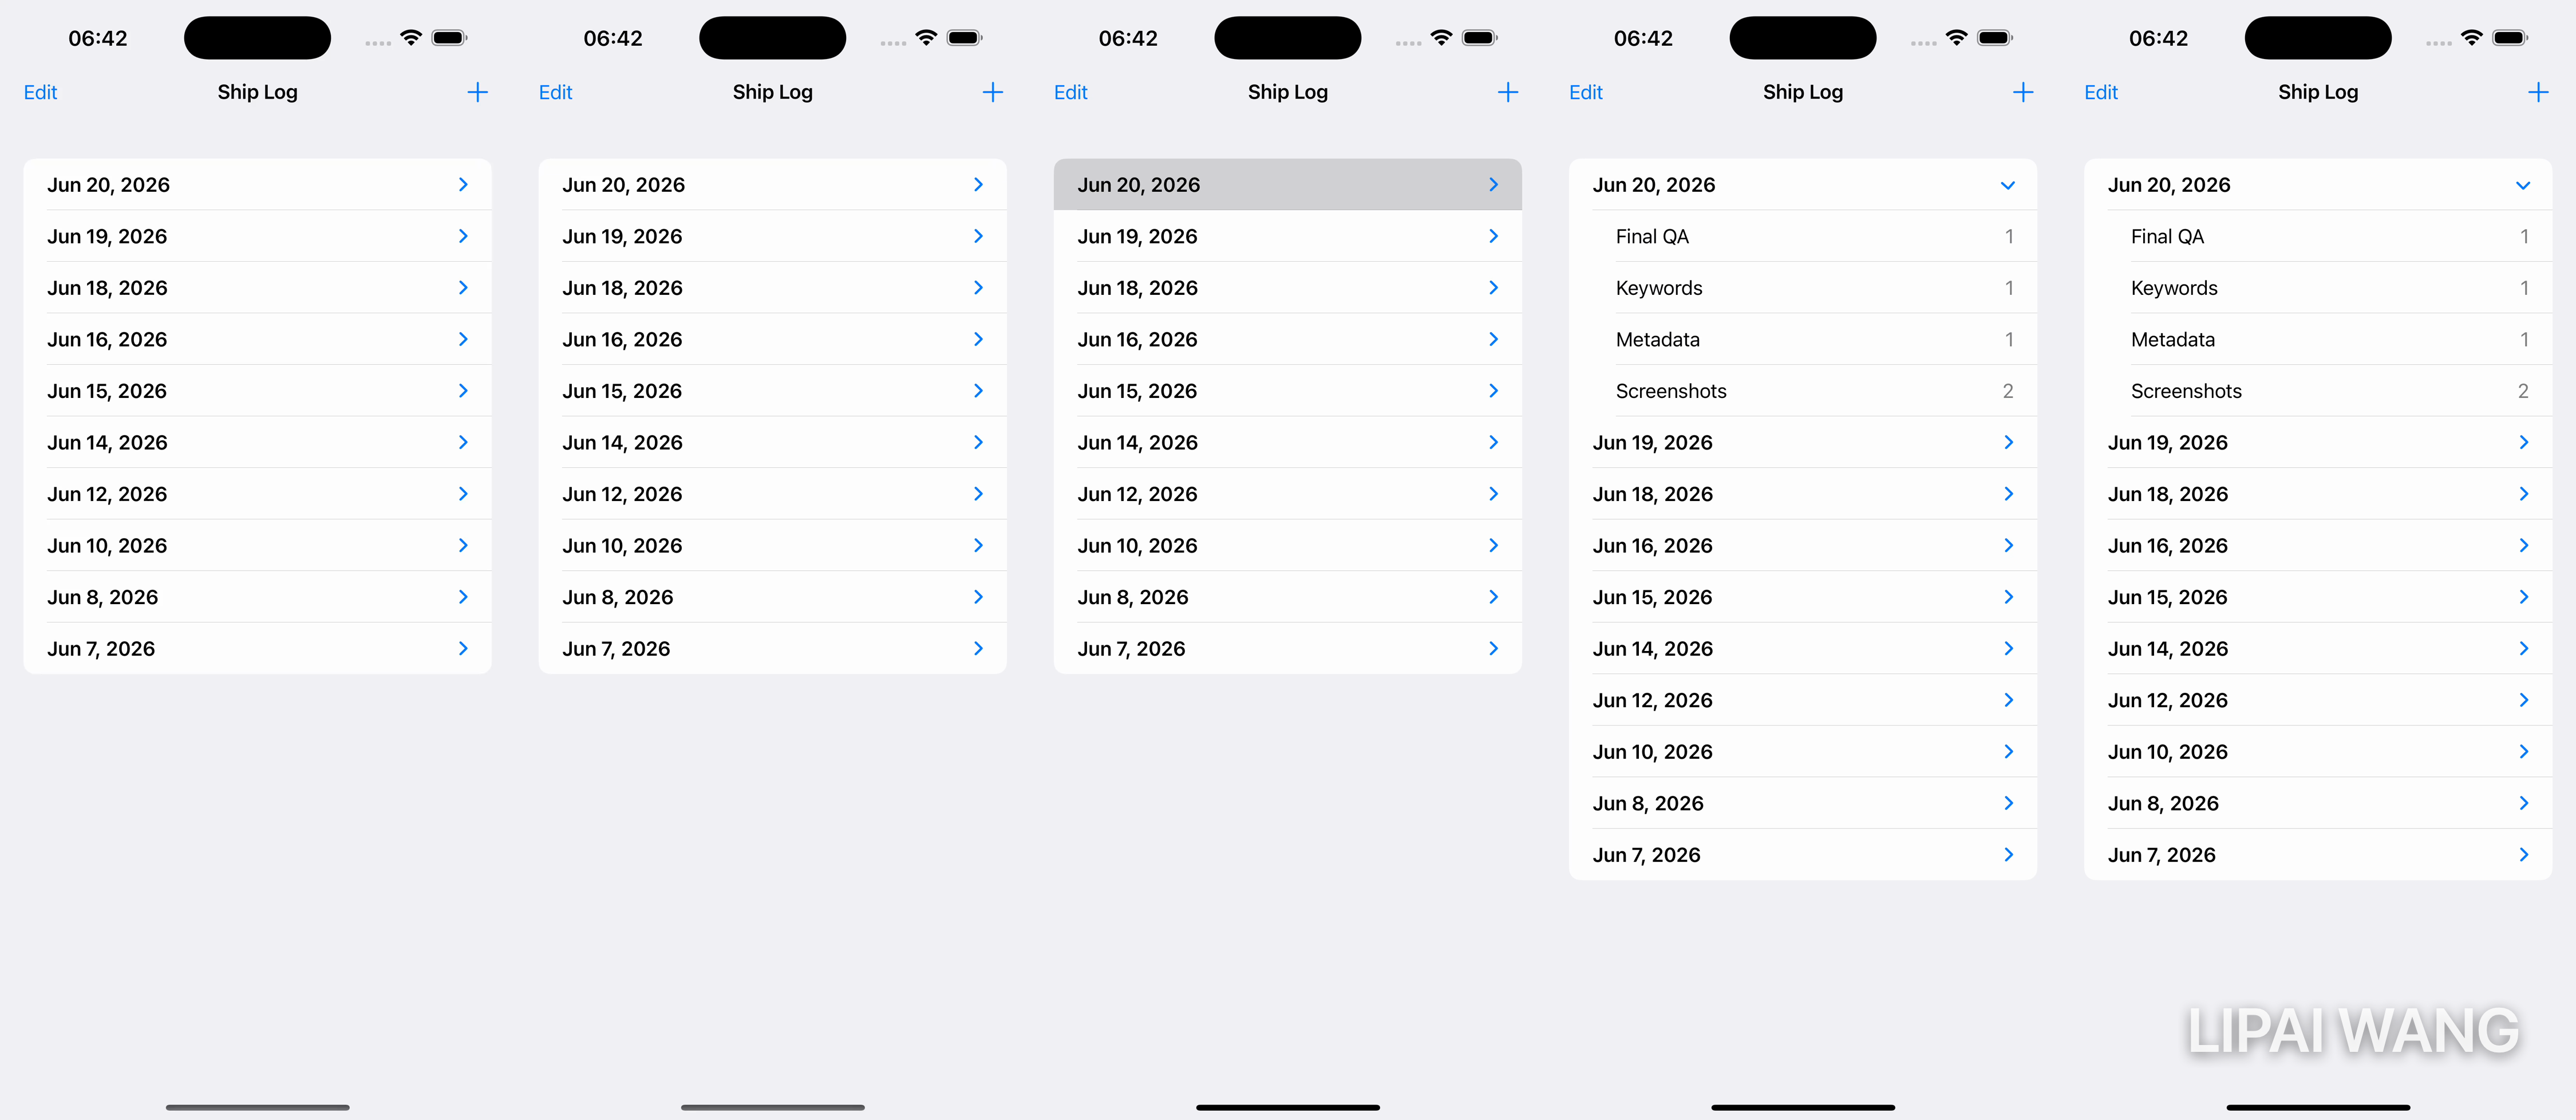
DisclosureGroup is the manual route. If your model is self-similar — a type with a children property of its own type, like a folder of folders — List(items, children: \.children) { item in … } builds the whole expandable tree automatically, no DisclosureGroup needed. Our log is only two levels deep (day → steps, which are plain strings), so the explicit group is the right fit.
Delete days, not steps
There's a catch. With the step rows now inside the list's edit machinery, swiping a step tries to delete the whole day — because the list's deletable level is the top one. Lock the children down:
ForEach(day.uniqueSteps, id: \.self) { step in
  Text(step).badge(day.count(of: step))
}
.deleteDisabled(true)
Now only days delete. (If you genuinely needed to delete individual steps, you'd restructure the data so steps were the top level, or drop editActions and write your own ForEach { … }.onDelete(perform:) — but here, day-level deletion is what we want.)
The Edit Button
Swipe-to-delete handles one row at a time. For clearing several at once, SwiftUI ships a button that does all the work — EditButton toggles the list into edit mode, where every deletable row grows a red minus control. Drop it in the toolbar:
.toolbar {
  ToolbarItem(placement: .topBarLeading) { EditButton() }
}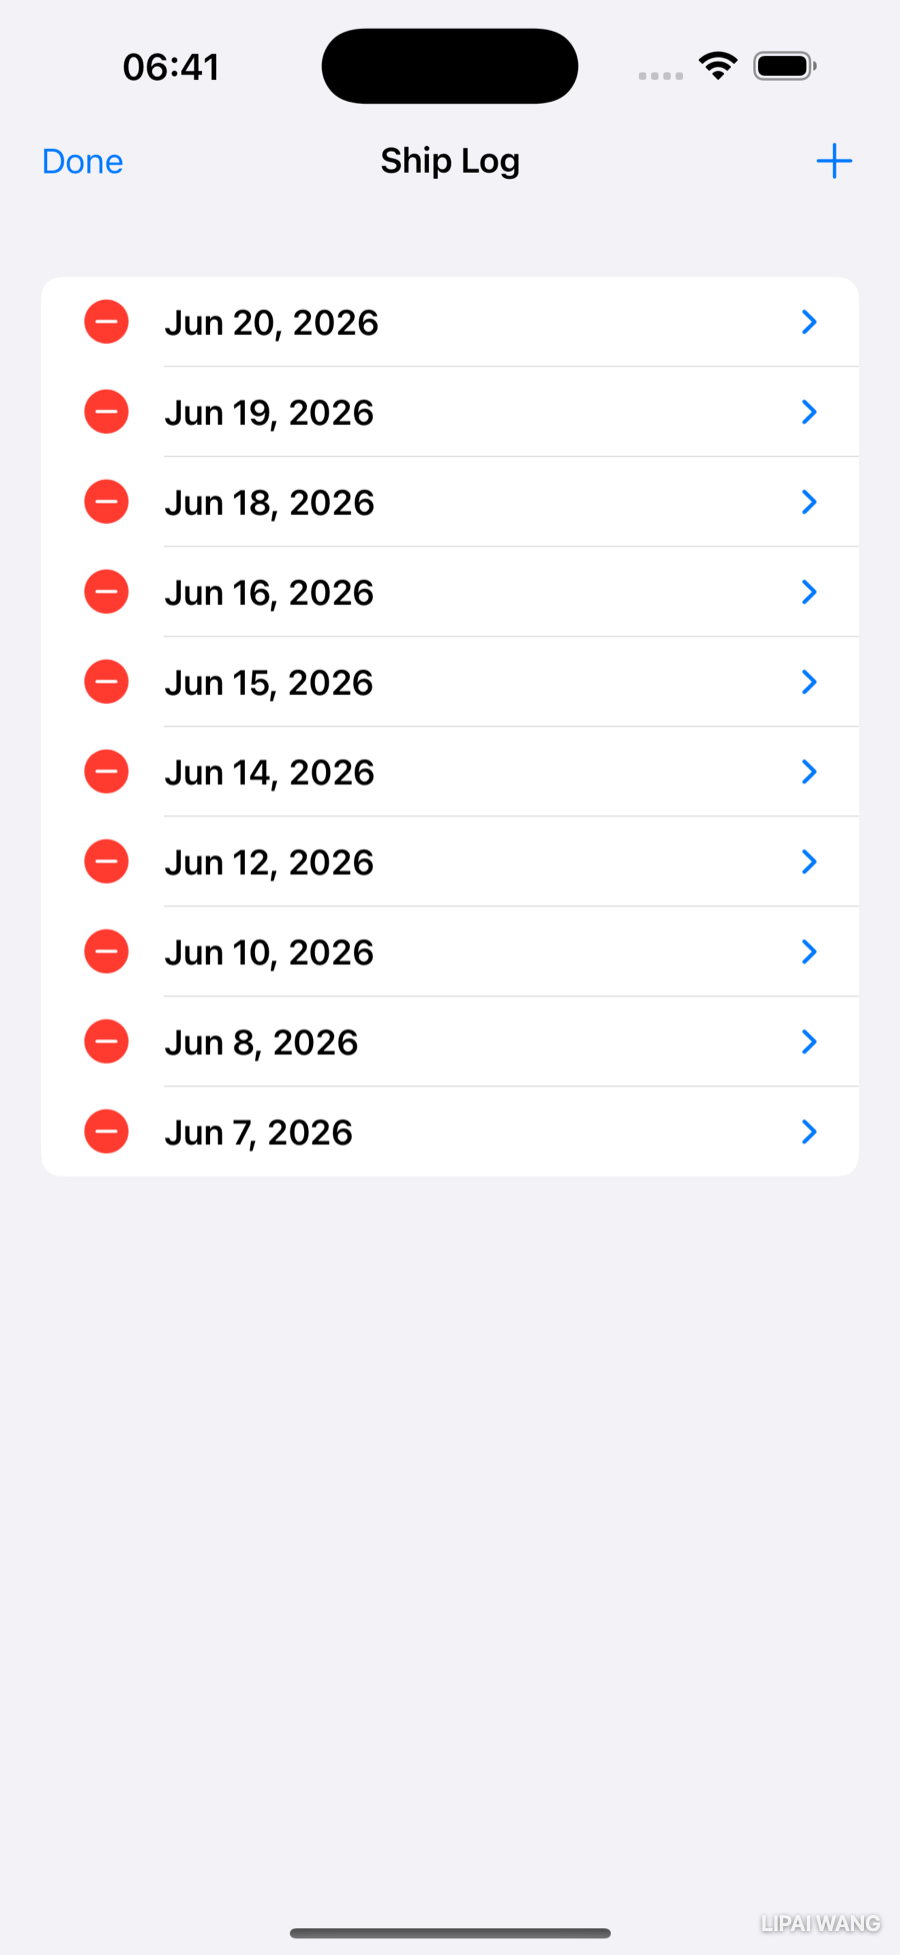
Tap Edit, remove what you like, tap Done. You wrote zero lines of edit-mode logic.
Adding Data With a DatePicker
Deleting is easy; adding takes a little UI, because the user has to pick which day. You'll present a sheet with a calendar. Add the toggle and a + button:
@State private var addMode = false
// in .toolbar:
ToolbarItem(placement: .topBarTrailing) {
  Button { addMode = true } label: { Image(systemName: "plus") }
}
// on the list:
.sheet(isPresented: $addMode) { AddShipDayView(store: store) }
The sheet's centerpiece is DatePicker:
DatePicker(
  "Date",                       // label (hidden by some styles)
  selection: $date,             // the bound date
  in: ...Date(),                // closed range — no future dates
  displayedComponents: .date)   // date only, no time
.datePickerStyle(.graphical)    // full month calendar
Each argument is a dial you can turn: the in: range here forbids future dates, displayedComponents drops the time, and .datePickerStyle swaps between a .wheel, a compact .compact dropdown, or the full .graphical calendar. Above it, a row of step buttons (reusing the embossed style from Chapter 6) logs a tapped step on the chosen date:
HStack {
  ForEach(ShipLogStore.allSteps, id: \.self) { step in
    Button(step) { store.add(step: step, on: date) }
  }
}
.buttonStyle(.embossed)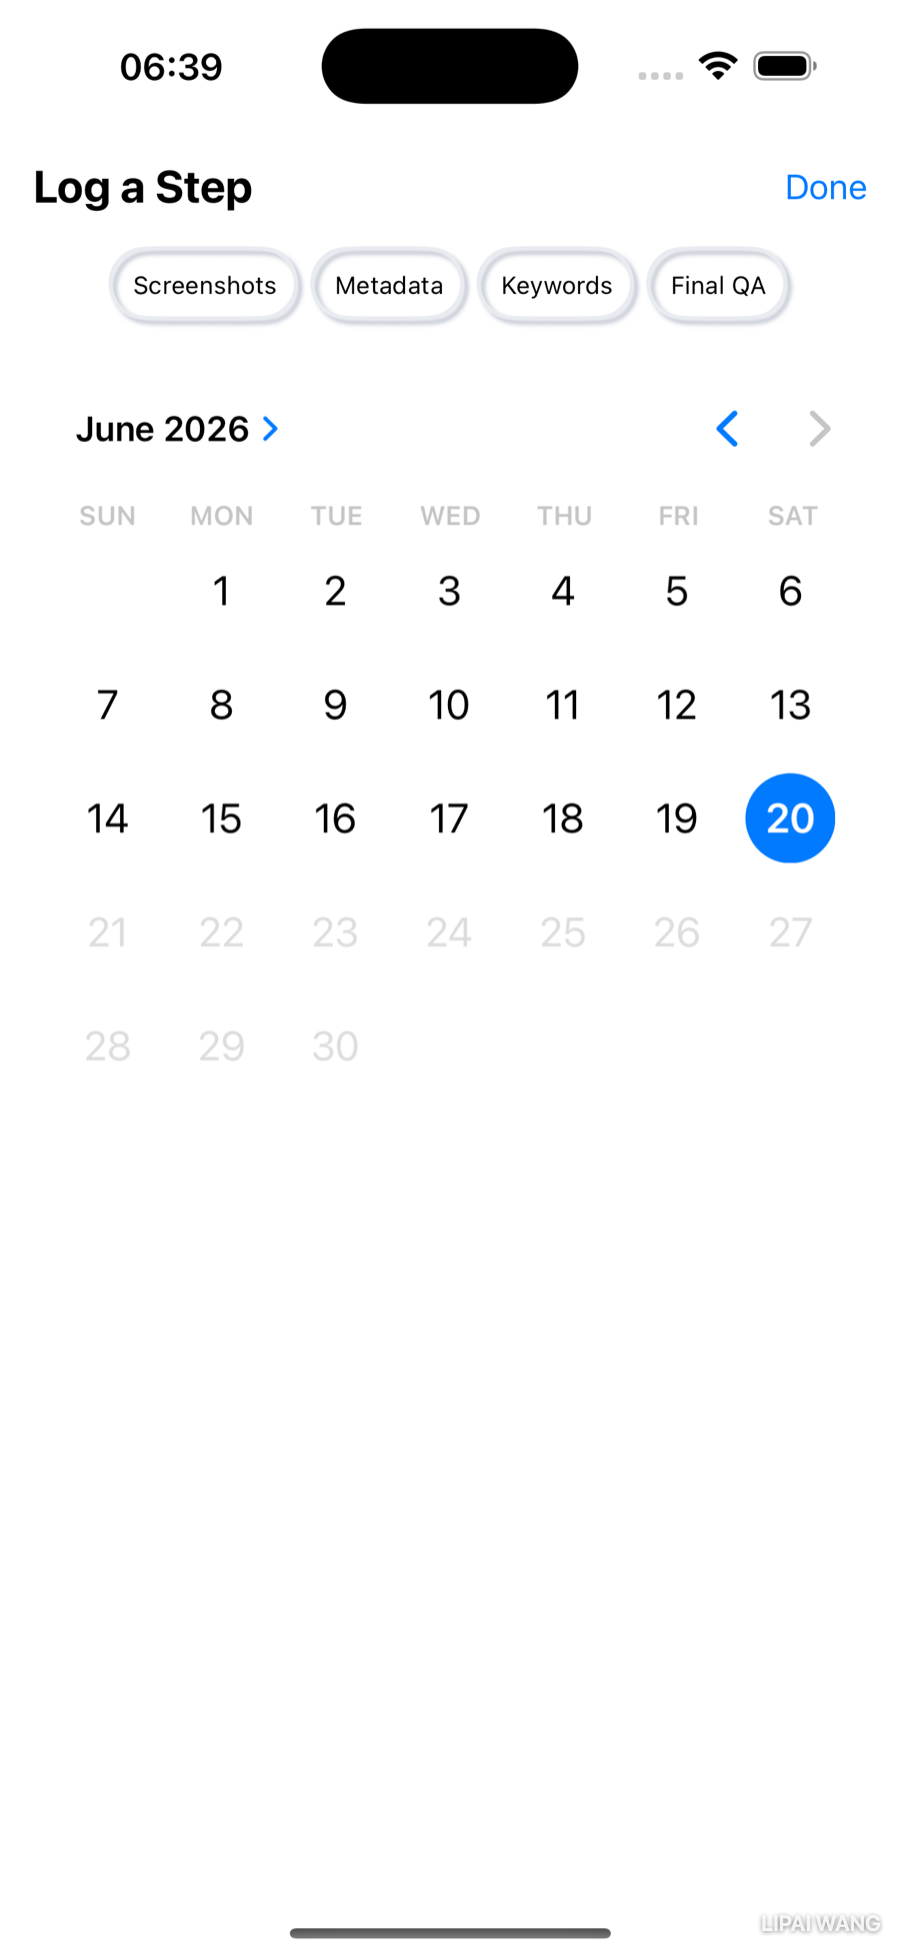
Inserting in the right place
The store keeps days sorted newest-first, so add(step:on:) has to find the right slot — append to an existing day, or insert a new one in order:
func add(step: String, on date: Date) {
  let cal = Calendar.current
  if let i = days.firstIndex(where: { cal.isDate($0.date, inSameDayAs: date) }) {
    days[i].steps.append(step)               // day exists → add to it
  } else if let i = days.firstIndex(where: { $0.date < date }) {
    days.insert(ShipLogDay(date: date, steps: [step]), at: i)  // insert in order
  } else {
    days.append(ShipLogDay(date: date, steps: [step]))         // oldest → end
  }
}
firstIndex(where:) walks the array and returns the index of the first element matching a condition you supply as a closure — first a same-day match, then the first day older than the new one. The three branches cover "day already logged," "fits in the middle," and "older than everything."
Swift Charts
A list is good for reading the log. To see it, reach for Swift Charts — a declarative framework where you describe marks and it draws the graph. Import it, then describe a chart with Chart { } and one mark per data point:
import Charts

Chart {
  BarMark(x: .value("Step", "Screenshots"), y: .value("Count", 2))
  BarMark(x: .value("Step", "Metadata"), y: .value("Count", 1))
}
A mark is the visual element — here a BarMark, a rectangle. Each axis takes a plottable value: .value(label, data) pairs a description with the datum. One axis carries the categories (the step names), the other the numbers (the counts).
Every Swift Chart is the same three ideas: a Chart container, one or more marks inside it (BarMark, LineMark, PointMark, AreaMark, RuleMark, RectangleMark), and plottable values mapping your data onto the x and y axes. Change the mark type and the same data becomes a different chart — that's the whole framework.
Here's the data-flow you've built, from raw log to both readable list and chart:
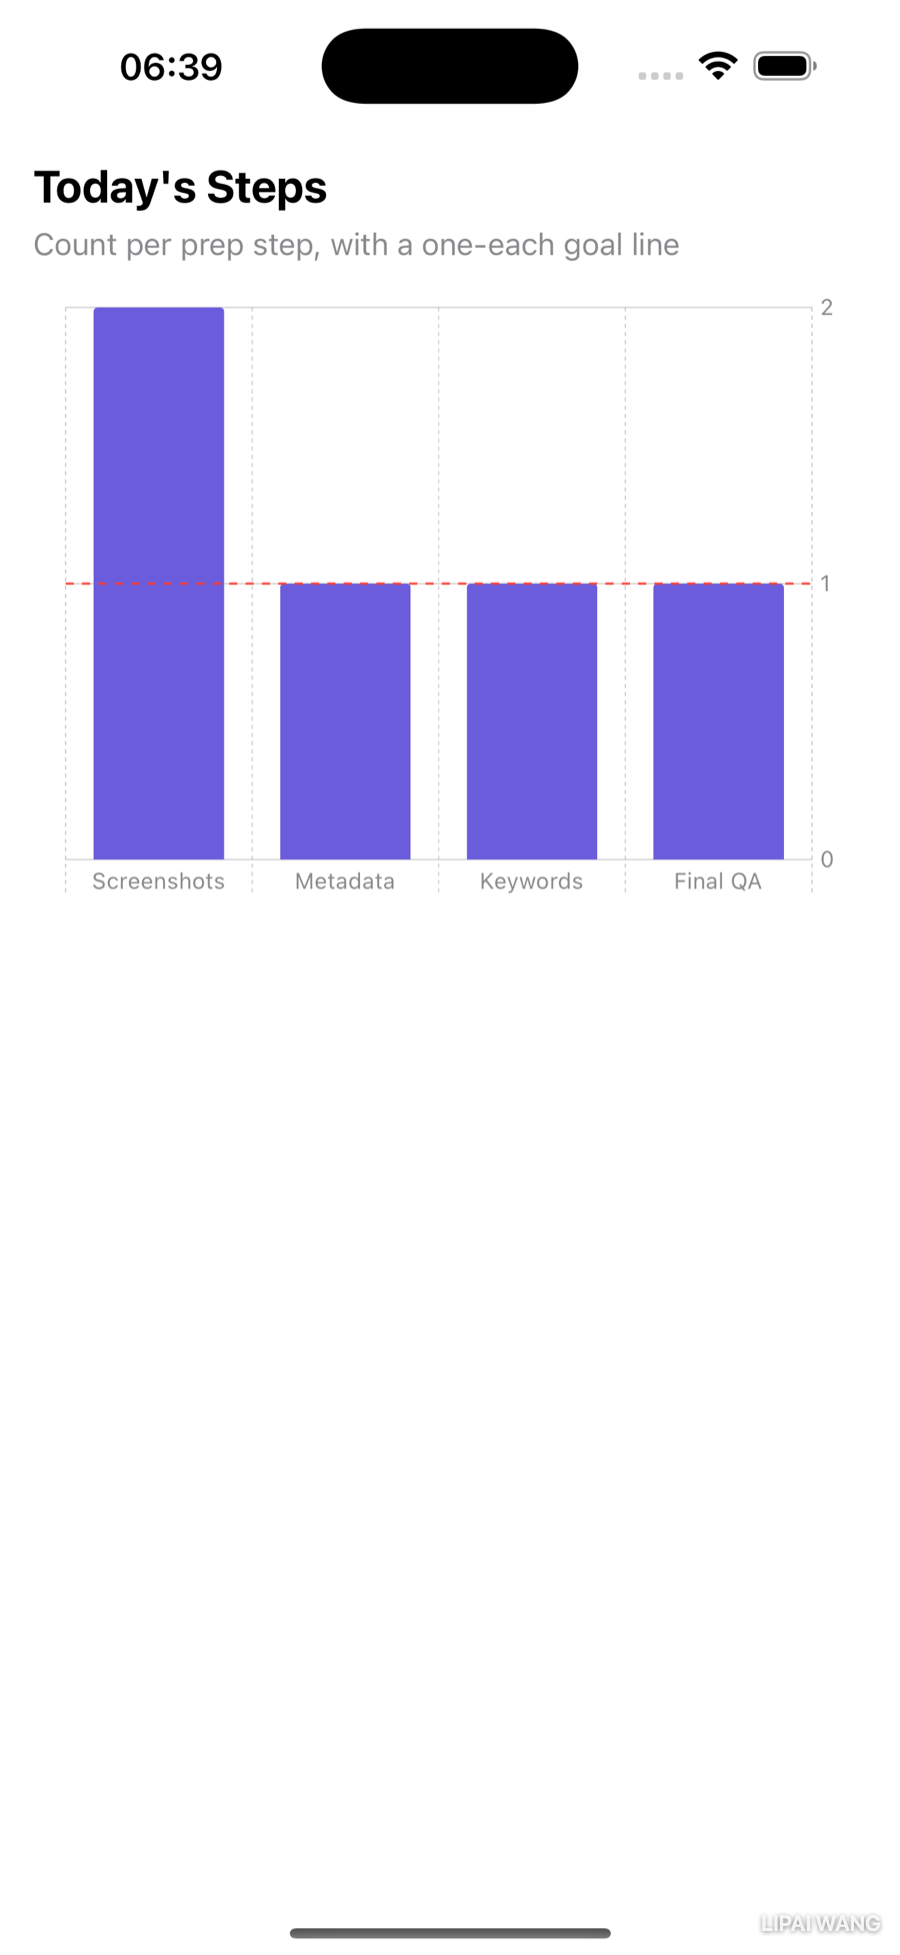
A chart from real data
Loop the marks over the four steps, height = that day's count, plus a dashed RuleMark to mark a "do at least one of each" goal:
Chart {
  ForEach(ShipLogStore.allSteps, id: \.self) { step in
    BarMark(
      x: .value("Step", step),
      y: .value("Count", day.count(of: step)))
    .foregroundStyle(Color.historyBar)
  }
  RuleMark(y: .value("Goal", 1))
    .foregroundStyle(.red)
    .lineStyle(StrokeStyle(lineWidth: 1, dash: [4]))
}
foregroundStyle recolors the bars; the RuleMark draws a reference line straight across. The chart auto-scales to the tallest bar.
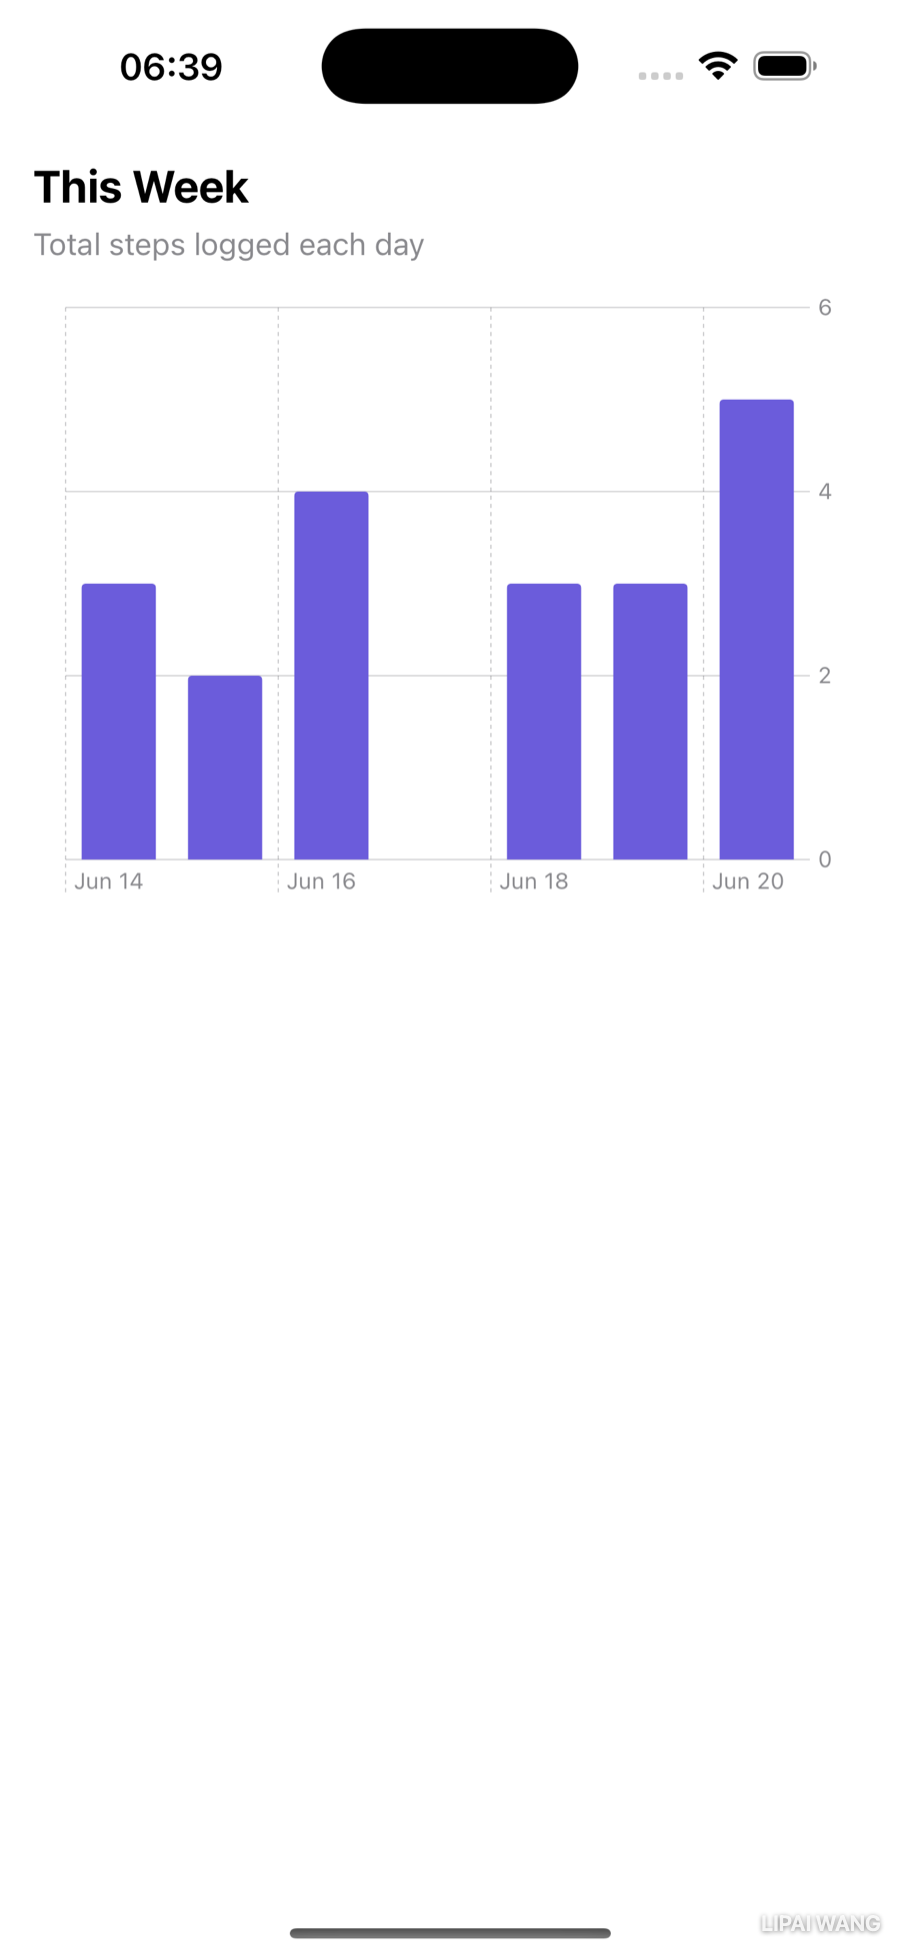
Charting a week
When you don't need a separate ForEach, hand the data straight to Chart. Group by day and total each day's steps:
Chart(store.days.prefix(7)) { day in
  BarMark(
    x: .value("Date", day.date, unit: .day),
    y: .value("Total", day.steps.count))
}
Passing unit: .day tells the chart the x-axis is dates by day, so it spaces them on a real calendar — and renders an empty slot for any day with no data, instead of silently skipping it.
Real logs have gaps. If a week has quiet days, build the seven-day window yourself and fill the holes with empty records, so the chart always shows a full week:
static func lastSevenDays(from days: [ShipLogDay]) -> [ShipLogDay] {
  let cal = Calendar.current
  let today = cal.startOfDay(for: Date())
  return (0..<7).reversed().map { offset in
    let date = cal.date(byAdding: .day, value: -offset, to: today) ?? today
    return days.first { cal.isDate($0.date, inSameDayAs: date) }
      ?? ShipLogDay(date: date)
  }
}
Feeding lastSevenDays(from:) to the chart guarantees seven bars, gaps included. Shaping data to suit the view is half of charting.
Line, point, area — and layering
Swapping the mark type reshapes the chart with no other change. A LineMark with a few modifiers makes a smooth trend:
LineMark(
  x: .value("Date", day.date, unit: .day),
  y: .value("Total", day.steps.count))
.symbol(.circle)                          // a dot at each point
.interpolationMethod(.catmullRom)         // smooth curve, not straight segments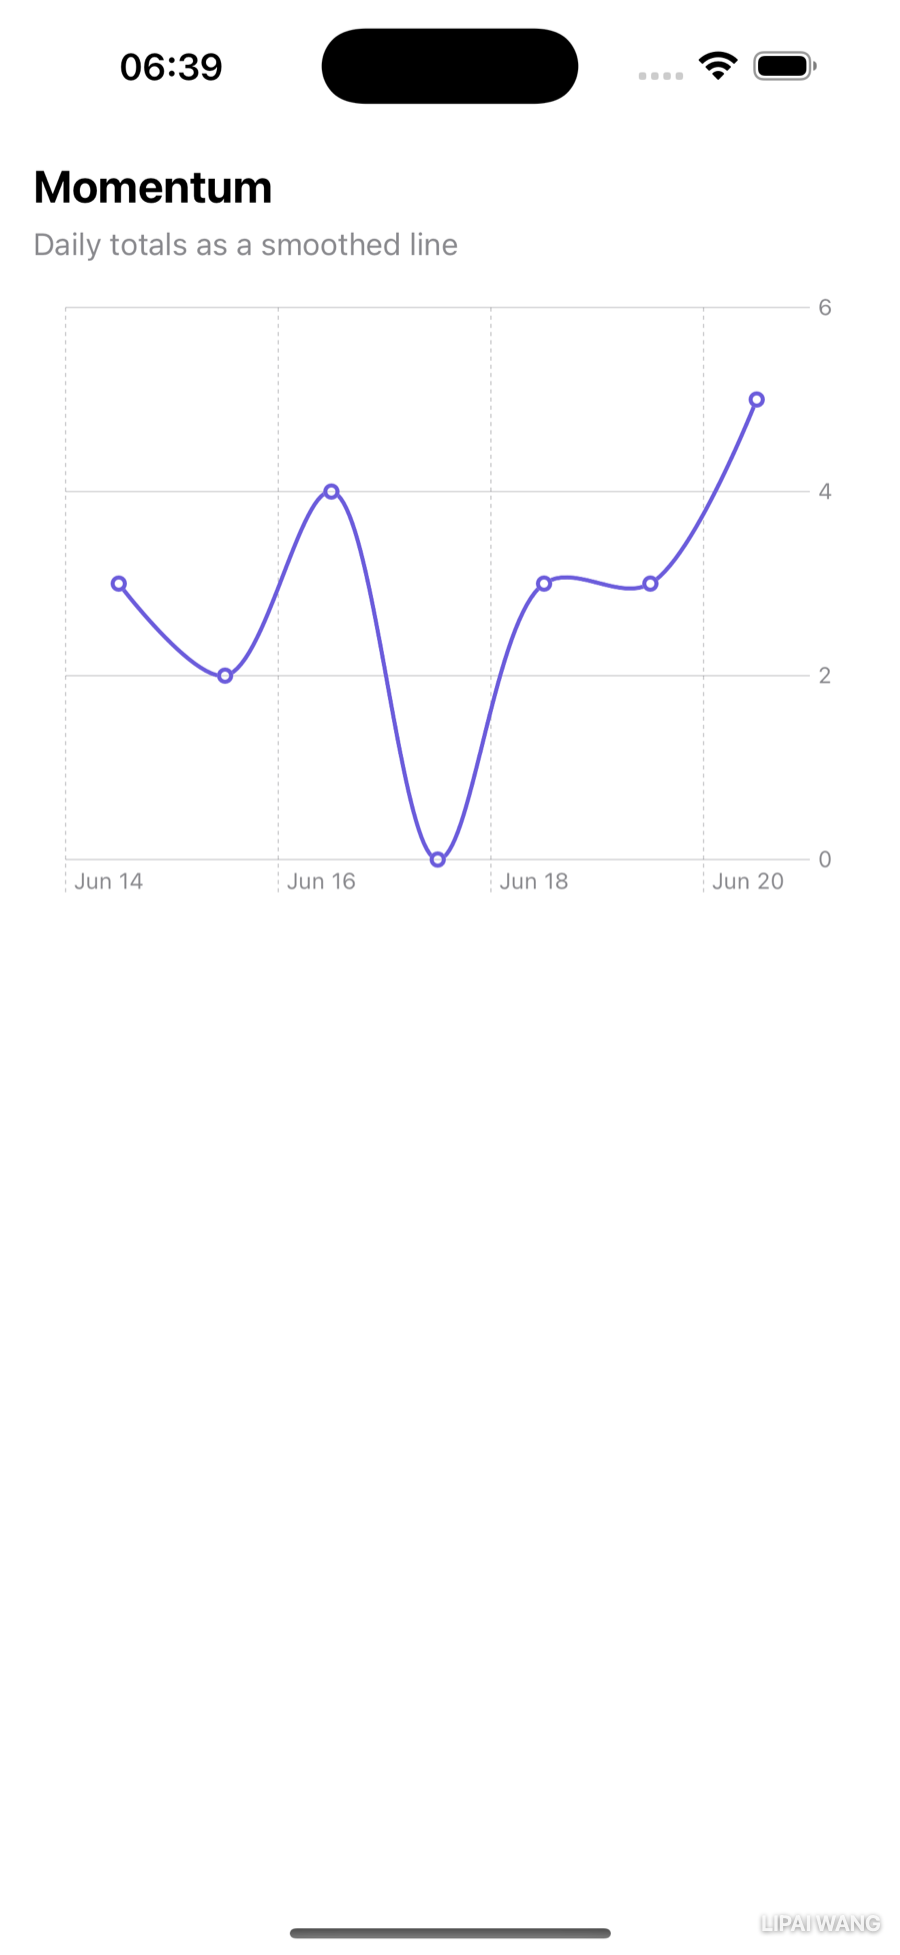
Try PointMark, AreaMark, and RectangleMark too — same data, different feel. You can even layer marks by listing more than one inside Chart { }: an AreaMark with a PointMark on top reads as a filled trend with emphasized data points.
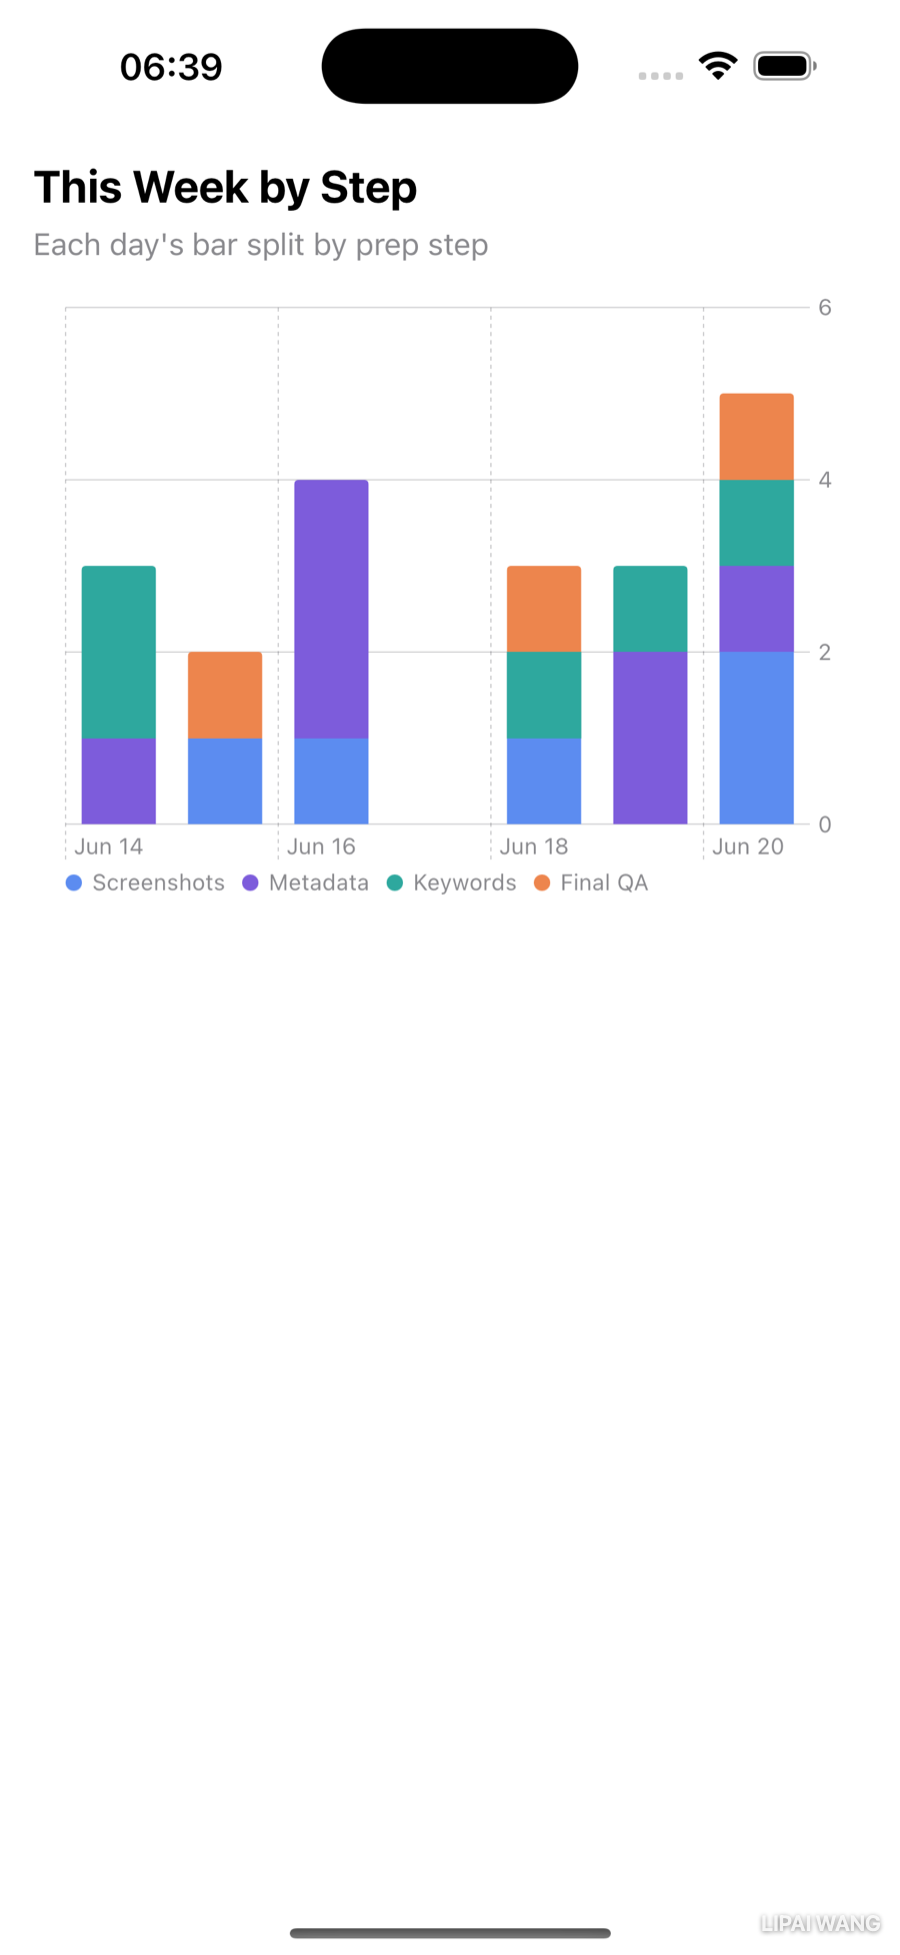
Stacked bars and custom colors
One bar per day hides which steps you did. Split each bar by step, the same way you deduped the list — a ForEach of step names inside the chart, colored by the step:
Chart(ShipLogStore.lastSevenDays(from: store.days)) { day in
  ForEach(ShipLogStore.allSteps, id: \.self) { step in
    BarMark(
      x: .value("Date", day.date, unit: .day),
      y: .value("Count", day.count(of: step)))
    .foregroundStyle(by: .value("Step", step))
  }
}
.chartForegroundStyleScale([
  "Screenshots": Color.stepScreenshots,
  "Metadata": Color.stepMetadata,
  "Keywords": Color.stepKeywords,
  "Final QA": Color.stepFinalQA
])
foregroundStyle(by:) tells Charts to assign a series per step — it stacks them in one bar and generates a legend automatically. chartForegroundStyleScale then overrides the auto colors with your own palette.
A Word on Privacy
History data is powerful — trends reveal habits, and habits are personal. The moment you collect, store, or chart a user's activity over time, you're holding something they trust you with. Keep it on-device unless you have a clear reason and clear consent to do otherwise, collect only what the feature needs, and read Apple's Protecting the User's Privacy before any data leaves the phone. The most respectful analytics are often the ones you never upload.
Key Points
- A
Setis an unordered collection of unique values — the idiomatic way to deduplicate an array (Array(Set(items))). Count occurrences withfilter { … }.count. .badge(_:)shows supplementary info, like a count, at a row's trailing edge.List($data, editActions: [.delete])gives swipe-to-delete for free; passing a binding is what makes the data mutable. Add.movefor reordering,EditButton()for bulk edit mode, and.deleteDisabled(true)to lock a level. Persist edits in.onDisappear(with scene-phase as a backstop).DisclosureGroupcollapses and expands hierarchical data; truly recursive models get automatic disclosure viaList(_, children:).DatePickerpicks a date — constrain it with a range (in: ...Date()), choosedisplayedComponents, and pick a.datePickerStyle(.graphical,.wheel,.compact).- Swift Charts: a
Chartholds marks (BarMark,LineMark,PointMark,AreaMark,RuleMark) plotted with.value(_:_:). Passunit: .dayfor date axes, layer marks by listing several, and split a mark into series withforegroundStyle(by:)plus a customchartForegroundStyleScale. - Charts often need shaped data — fill gaps and build windows yourself so the view has exactly what it needs.
Challenge: A Reports Screen
You've built four charts; now give them a home.
- Add a Reports button beside the log's + button that presents a modal sheet.
- In the sheet, put a
Picker(segmented style) that switches between Bar and Line for the week's totals — reuseWeekBarChartandLineTrendChart, swapping which one shows based on the picker's selection. - Stretch: add a second
Pickerto choose the window — last 7 days vs last 14 — and generalizelastSevenDays(from:)intolastDays(_ n: Int, from:). Confirm both windows gap-fill correctly.
Build it, log a few steps on past dates with the DatePicker, then open Reports and watch the charts redraw. When that works, ShipShape doesn't just store your release history — it explains it.
That completes ShipShape's data story: it captures a draft, remembers it, lets you edit and grow a history, and turns that history into charts you'd actually act on. You've now got the everyday SwiftUI data toolkit — Set, List editing, DisclosureGroup, DatePicker, and Swift Charts — that shows up in nearly every real app. Next you'll polish how all of this moves: animating the disclosure and chart transitions, and choreographing the screens so the app feels as considered in motion as it does at rest.

Ultimate iOS Bootcamp: Master Swift & SwiftUI App THE HARD WAY
Ship your apps faster
When you're ready to publish your Swift app to the App Store, Simple App Shipper handles metadata, screenshots, TestFlight, and submissions — all in one place.
Try Simple App Shipper